
2/24/22 – This research was used as the basis for a 8-minute Renaissance Society of America Graduate Student Lightning Talk panel. Click here for a video of my talk.
Paul Albert
George Mason University, Departments of Art History and Computational Social Sciences, 4400 University Dr, Fairfax, VA 22030, USA
| A R T I C L E I N F O
Article history: Submitted 5/15/19 GMU CSS 625 Complexity Theory Proposed Journal – Poetics Keywords: Art Collections Cultural Change Power Laws Zipf’s Law | A B S T R A C T
An examination of the subject matter classifications of 200,000 paintings listed in 4,171 early modern world art collections finds a distinctive pattern. The first ranked classification appears about twice as much as the second ranked, about three times as much as third ranked, four times as much as the fourth ranked, and so on. The exact distribution found mirrors the findings popularized by George Kingsley Zipf in examining rank frequency distributions among words in texts. This article examines “Zipf’s Law” and the general phenomenon of power laws in considering the distribution of cultural artifacts. Findings from the examination of the historical art collections dataset are presented and then possible generative “first principles” that might explain the findings are proposed. I then consider how these first principles might be extrapolated to shed light on the general phenomenon of cultural change and suggest a “toy model” to conceptually examine the interaction of these first principles. |
Exploring patterns and discovering the existence of general laws underlying collective human behavior could lie at the center of a hope to build a deep theory of social order.
(Devezas & Modelski, 2003)
NOTE: The software I used to translate Word documents for web display dramatically choked on translating the Word formatting used for this paper. For a better reading experience, a PDF of the paper can be found here here.
- Introduction
The phrase “a picture is worth a thousand words” was found 9.1 million times on the Internet in a May 2019 Google search. Despite the popularity of this specific adage, few would suggest that words are essentially the same as pictures. As a simple test to demonstrate this difference, Leonardo da Vinci once suggested writing the word “god” on one wall and then painting a picture of god on another wall in order to see which would generate more reverence (Blunt, 1939). However, as different as words and images might be (Gombrich, 1948), this article proposes that they display some key common patterns when considered in aggregate.
- Zipf distributions and power laws
In 1940, George Kingsley Zipf popularized what has become an often-studied phenomenon. In many texts, Zipf found that the most frequently used word was used about twice as much as the second most frequently used word, about three times as much as the third, about four times as much as the fourth and so on down to the least used word(s). Since this striking phenomenon was popularized by Zipf, this pattern has been found to occur in almost all languages (Yu, Xu, & Liu, 2018) and has become known as “Zipf’s Law.”
This same type of highly skewed distribution has been found to occur in many social distributions (city sizes (Gabaix & Ioannides, 2004), income distribution (Drăgulescu & Yakovenko, 2001), size of firms in the US (Axtell, 2001), severity of conflicts (Richardson, 1960), number of phone calls or emails individuals receive (Krings, Calabrese, Ratti, & Blondel, 2009), etc.) and in a smaller set of cultural distributions (first names given to babies (Newman, 2005), web site popularity (Krashakov, Teslyuk, & Shchur, 2004), frequency of pottery motifs used in Neolithic Germany (Bentley, Hahn, & Shennan, 2004) and auction prices of paintings (Etro & Stepanova, 2018), etc.). Perhaps, the fact that power laws have been found less often in cultural distributions than social distributions is due more to the focus of the particular scholars looking for them (McManus, 2006) and the greater existence of data for the social world.
In considering artworks, Zipf distributions have been found in the distribution of color “pixels” seen in 29,000+ individual paintings (Kim, Son, & Jeong, 2014), in the size of different elements of abstract paintings (Martínez-Mekler et al., 2009), in the rank frequency of specific elements in musical compositions (Manaris et al., 2005), and in the distribution of movie shot durations (Cutting, DeLong, & Brunick, 2018). One contribution of this paper is to add to the list of Zipf Laws in art by demonstrating that a Zipf distribution exists in the rank frequency distribution of subject matter classifications among 222,006 paintings in 4,171 early modern world art inventories.
- Getty Archival Inventories dataset overview
For this study, I will be using a snapshot of the Getty Archival Inventories dataset. Obtained from the Getty Research Institute in February 2019, the dataset reflects 34 years of cumulative work by the Getty by many subject matter experts. Primarily begun to help with provenance research into individual paintings, the Getty Archival Inventories dataset offers unique insight into the curatorial behavior that formed a large number of individual art collections.
Figure 1. Getty Archival Inventories dataset characteristics by country and year.
In general, most of the artworks in the dataset were paintings (>95%), most were from Italy (72%) and most inventories were created between 1600 and 1750 (86%). To process the 4,171 inventory documents, subject matter experts at GRI looked at the transcription text for each item in each inventory and, based on the text, assigned an Iconclass subject matter classification to the item. Typically, these inventories served as legal documents to settle estates or record dowries (Keating & Markey, 2010). Overall, the transcription description given for each item (average of 21 words) can be assumed to be descriptive enough to reliably to assign an Iconclass classification to the item. However, since less than 1.5% of the paintings covered in the dataset have been identified in existing locations today, it is problematic fully validate this process by comparing classifications with the actual pictures described in the inventories.
- Iconclass classification schema
Iconclass classifications can be thought of as being like a “Dewey Decimal System” for artworks (Van Straten, 1986). Figures 2 and 3, below, illustrate how GRI processed inventory descriptions and how the Iconclass schema works.
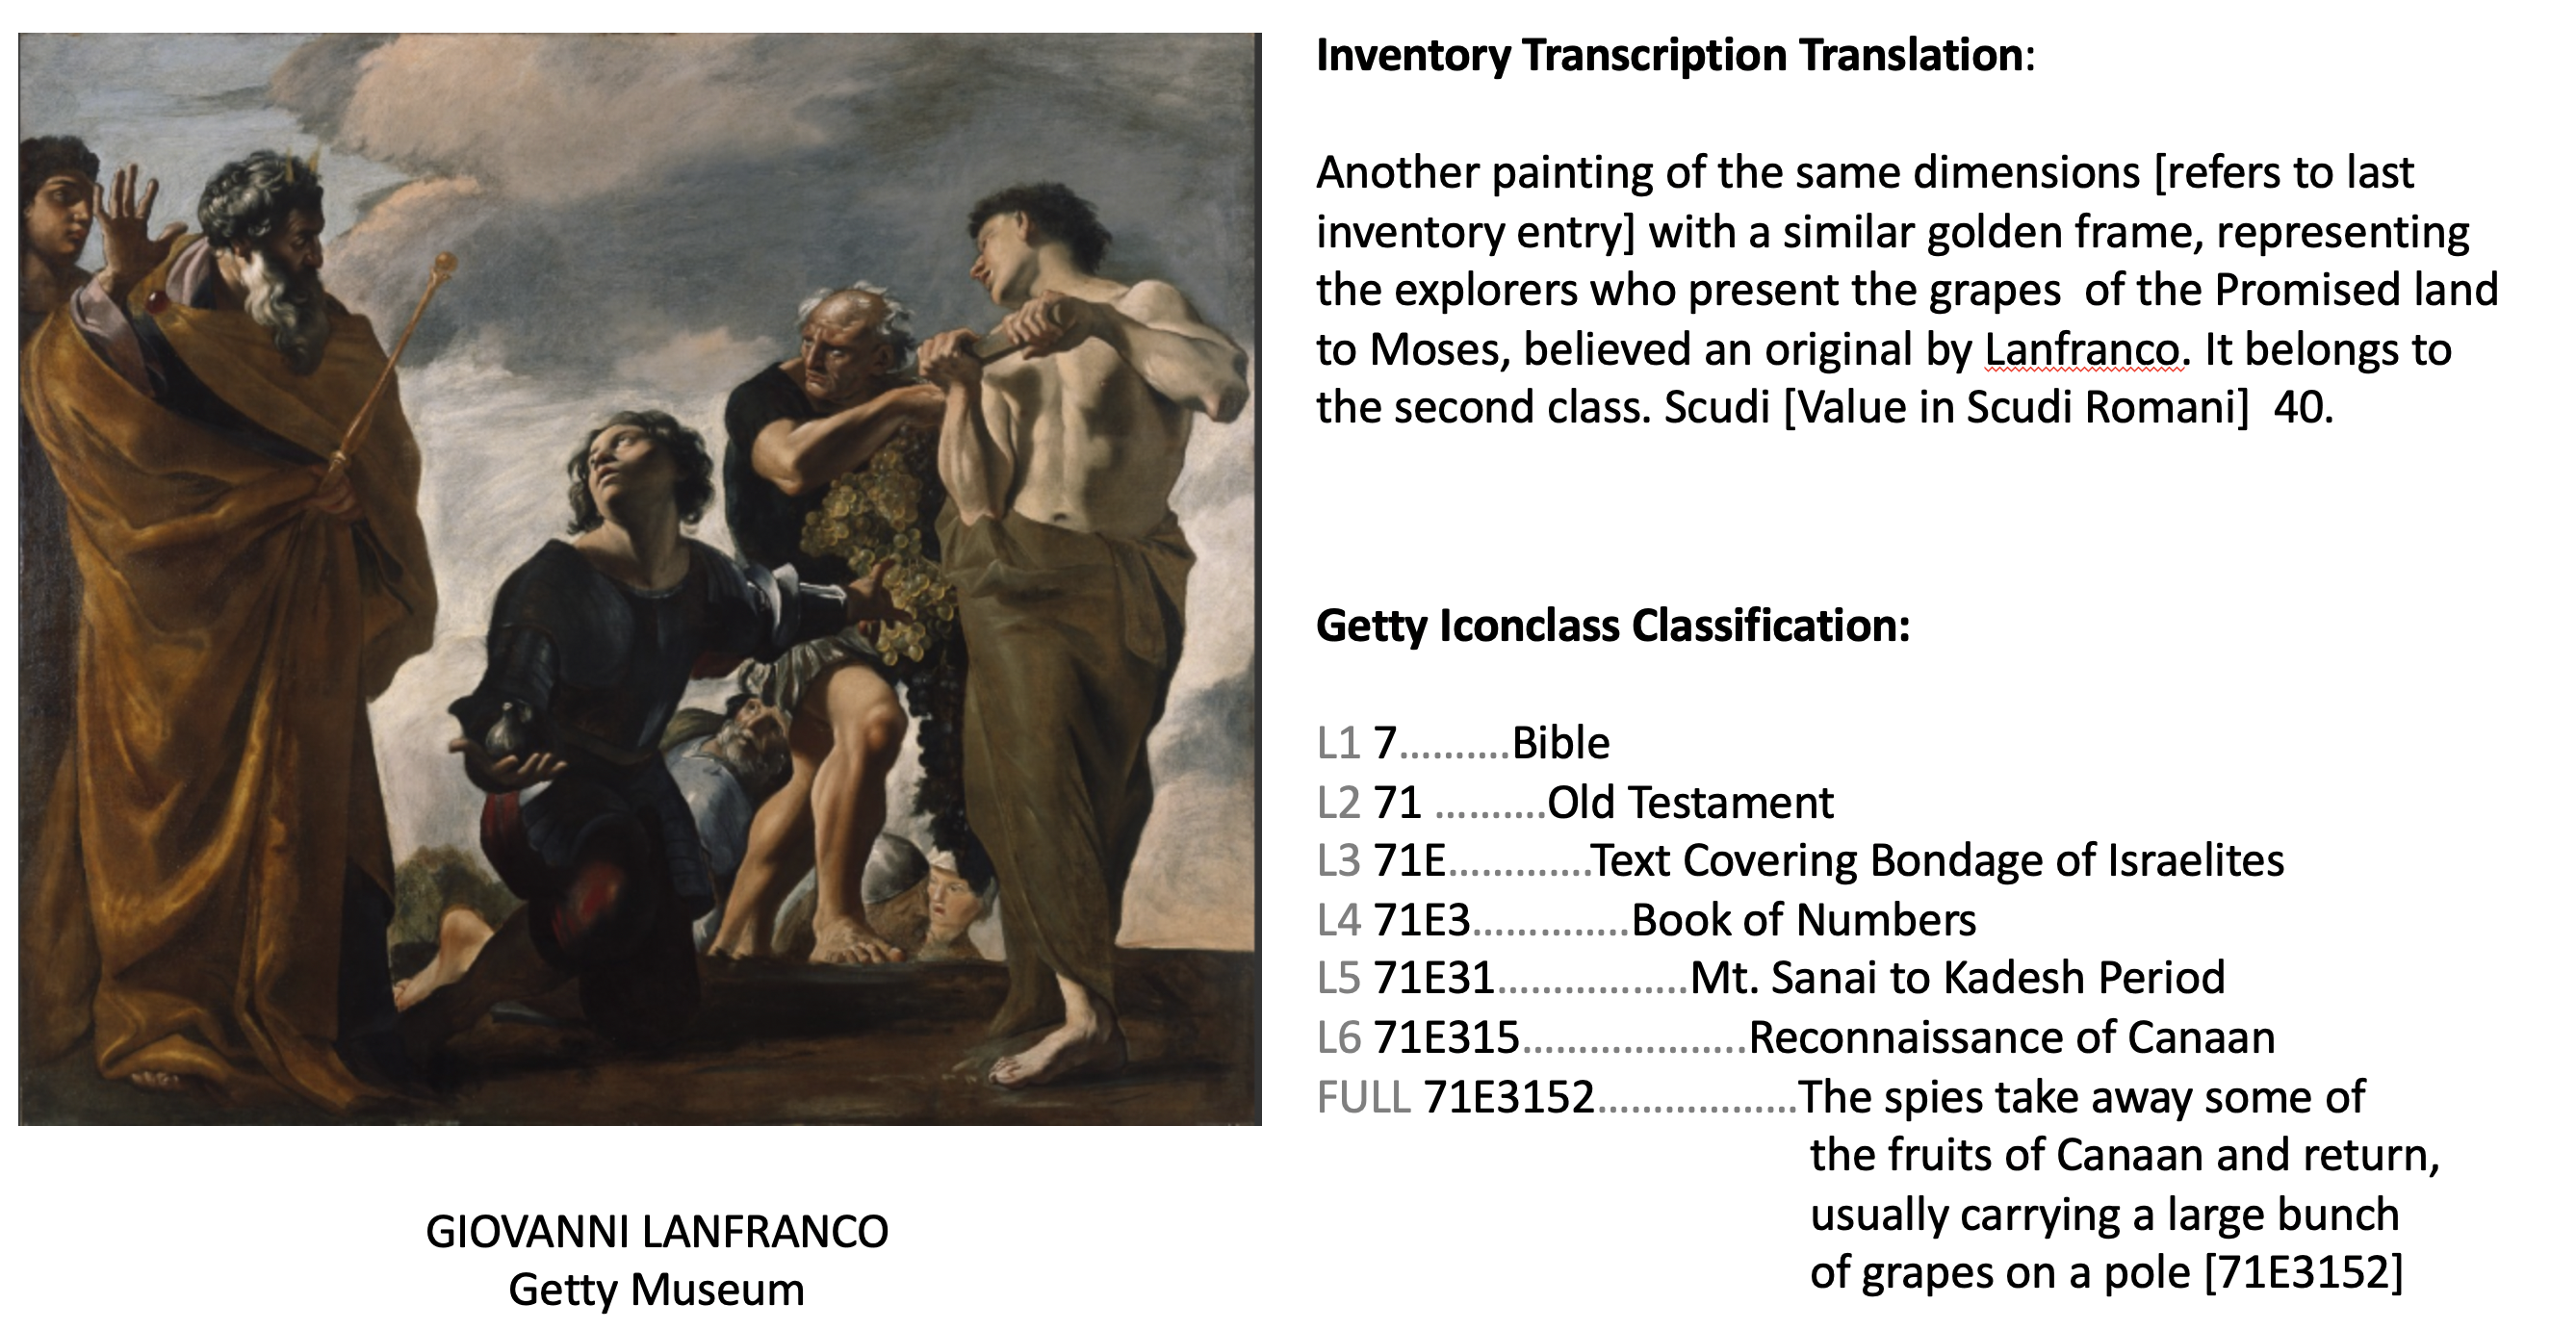
Figure 2. Example Painting 1, inventory transcription translation and Iconclass assignment
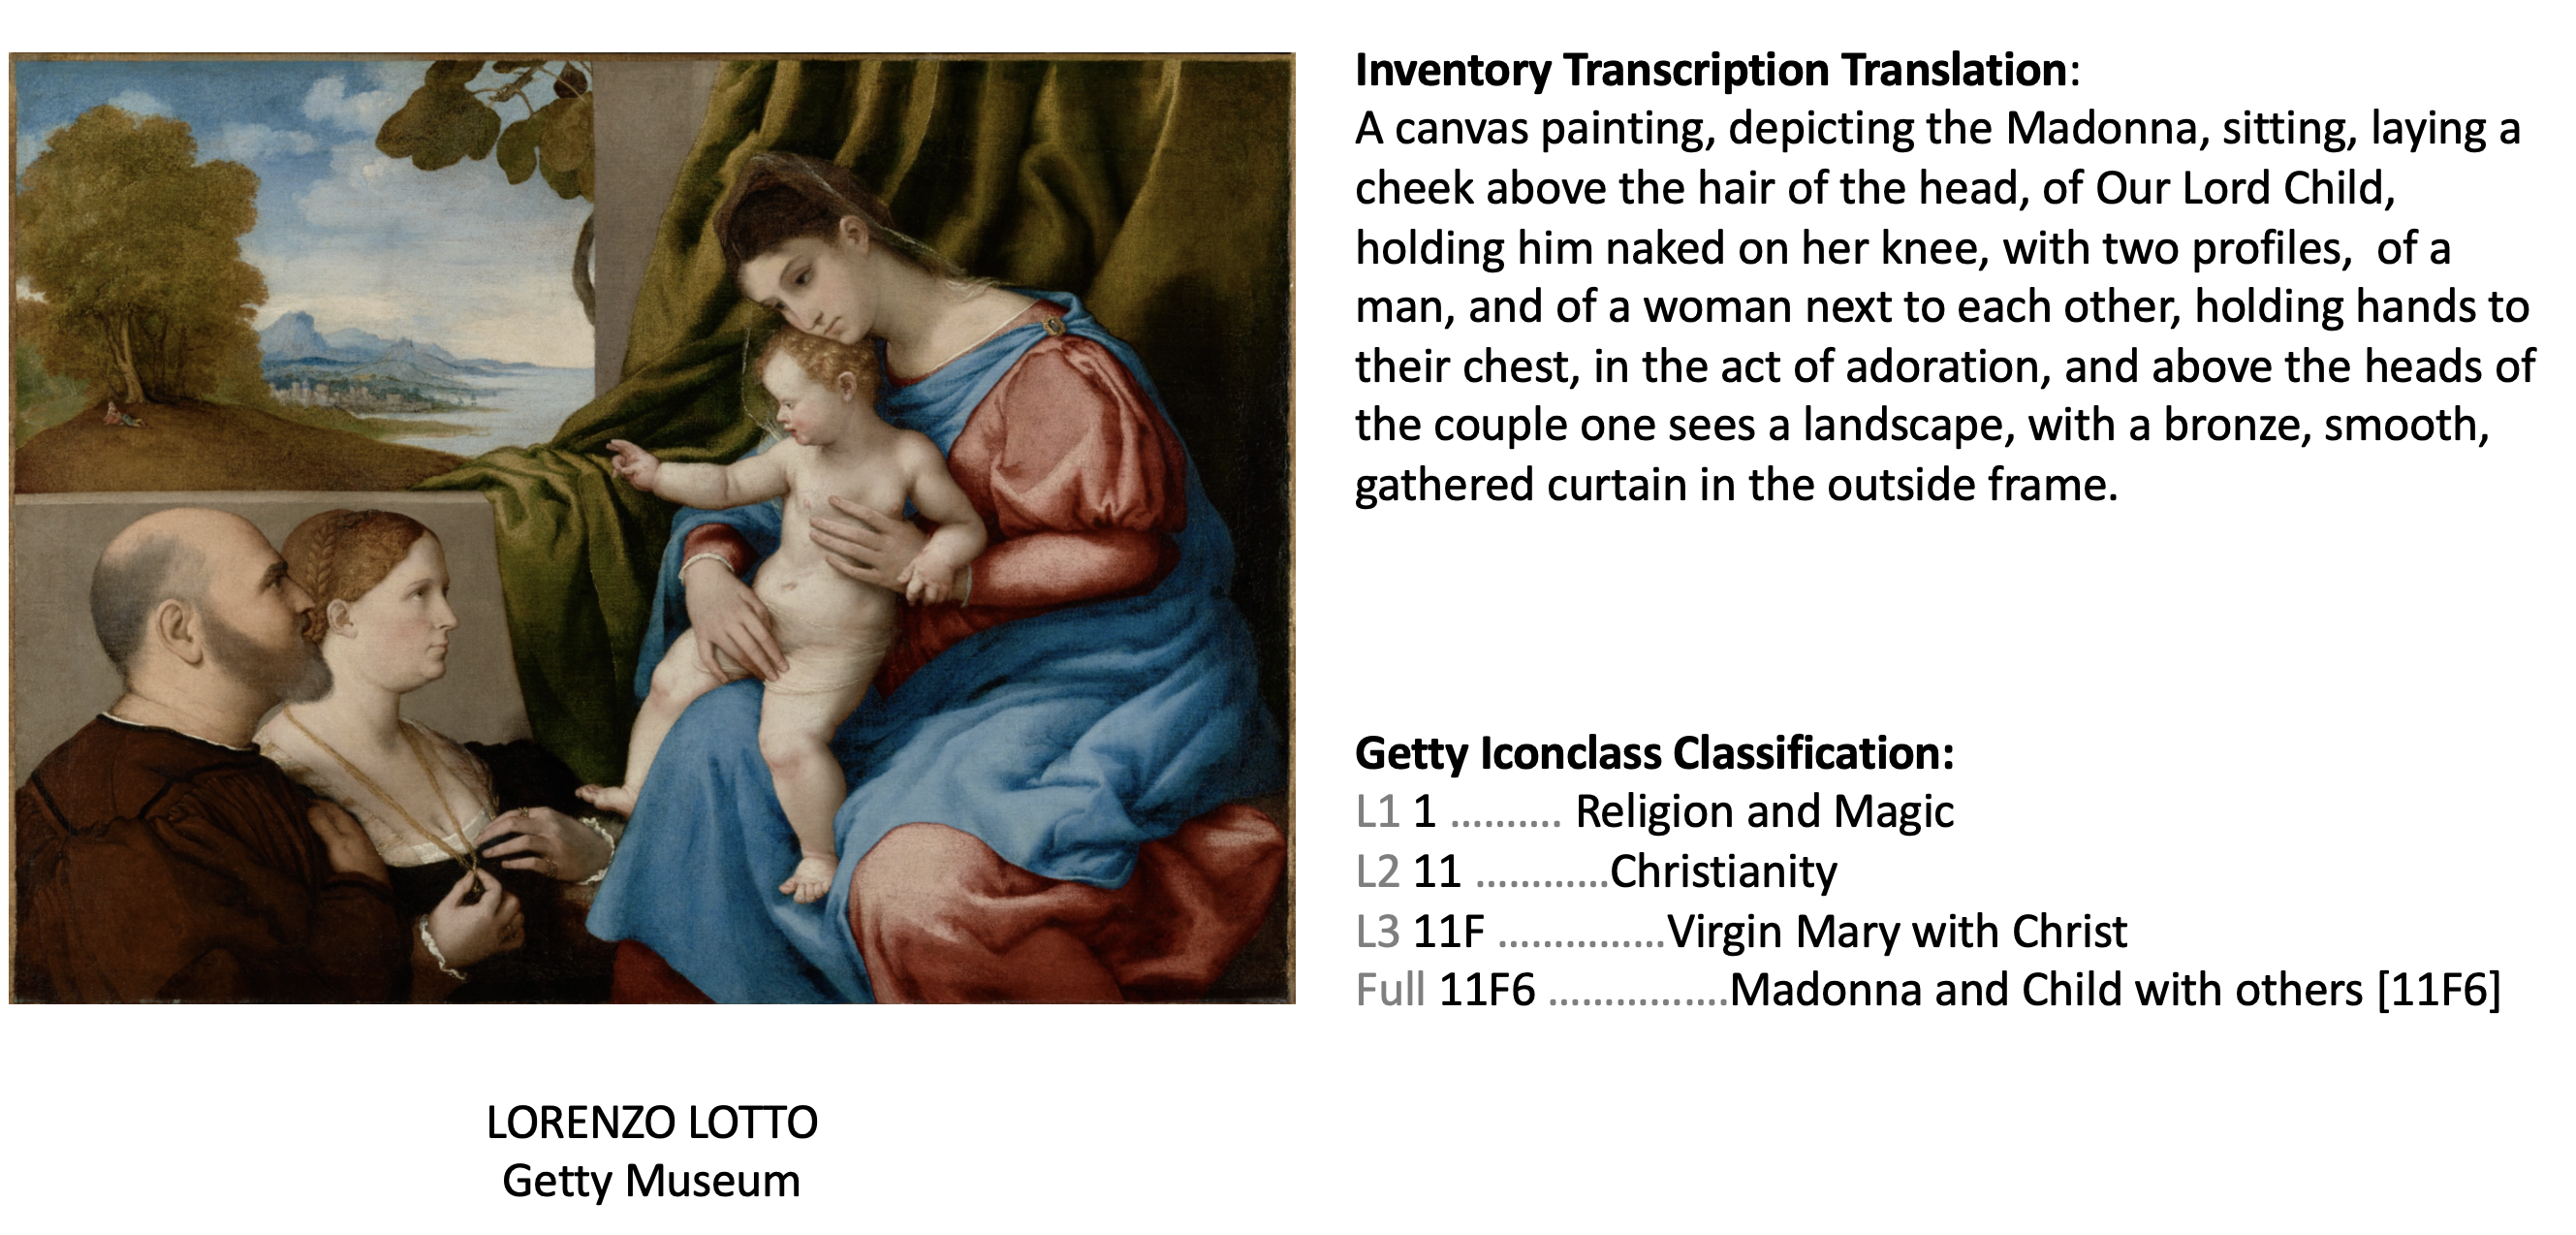
Figure 3. Example Painting 2, inventory transcription translation and Iconclass assignment
As shown in Figures 2 and 3, the full Iconclass classifications assigned to different pictures do differ in the number of Iconclass hierarchies used. Across the dataset, items have an average of 4.6 Iconclass hierarchies used in their full classification code.
Table 1
Dataset Iconclass frequencies.
| Iconclass Level | Number of Unique Classifications |
| L1 | 9 |
| L2 | 58 |
| L3 | 314 |
| Full | 25,944 |
In the discussion of findings that follow, I refer to L1 classification to describe classifications by their first character (e.g., “1”), L2 classification to describe classifications by their first two characters (e.g., “11”), L3 classification to describe the first three characters (e.g., “11F) and Full Classification to describe the full classification (e.g., “11F6 Madonna and Child with others”).
- Findings
- Rank frequency distribution in subject matter classifications is heavy tailed
In what is known as a “normal distribution” or a gaussian distribution, the distribution of elements follows a bell curve. For example, a distribution of height or weight recorded for a population of people would typically follow a “rare, some, rare” bell curve pattern. In contrast, a heavy tailed distribution follows a pattern of many small values, some mid-range values and a few high-range values. This has been called a “many, some, few” distribution (Alizadeh & Cioffi-Revilla, 2014).
As found in by Zipf in looking at the word rank frequencies in text, Subject Matter Classifications in the Getty Archival Inventories dataset show a very heavy tail. A few specific classifications are used to describe many items while many specific classifications are used to describe only a few items. Indeed, the top 1% of classifications are used for about 60% of the items and the bottom 80% of classifications are used for only about 10% of the items (Figure 4).
When we take the Rank of each classification and plot it against the number of items for that classification (Figure 5) we get a pronounced “L” shaped curve. However, if we rescale our axes to be logarithmic (Figure 6), our “L” shaped curve becomes a more or less straight line.
| Figure 4. The most popular 20% of classifications account for 90% of the paintings. | Figure 5. Full subject matter classification distribution by frequency. |
Figure 6. Distribution of full classifications is power law-like. Each dot represents a full subject matter classification. The top 20% of classifications are used for 90% of the items while 67% of classifications are found for only one item.
- Rank frequency distribution in subject matter of artwork follows Zipf’s Law
The generally monotonic log:log relationship in Figure 6 demonstrates that the variance among rank and frequency for the overall dataset is roughly proportionate across the entire distribution. A proportional change in rank results in a similar proportional change in frequency across the distribution. Remarkably, despite all the historical vagaries that went into creating the original inventory texts and the further potential human encoding vagaries in the Getty classification process, the slope of the distribution found is 1.00 (or more accurately, “-1.00”). This is exactly the rank frequency distribution slope that Zipf proposed to occur in language.
If the distribution of rank frequencies in full subject matter classifications followed an exact formal proportional variance like that demonstrated in some physical systems, it would be defined as a pure “power law.” However, as can be observed in Figure 6, our distribution does have a few squiggles in it and does not demonstrate a constant slope across all magnitudes.
A specific methodology has been proposed to test for power laws in empirical data (Clauset, Shalizi, & Newman, 2009). Using a library built for the statistical package R that encapsulates this methodology (Gillespie, 2014), the overall rank frequency distribution of full classifications shown in the dataset cannot statistically be proven to not be something other than a power law. Several scholars have questioned the appropriateness of this test methodology and pointed out that the noise inherent in actual empirical social data can easily overcome a clear power law generative dynamic (Voitalov, Van Der Hoorn, Van Der Hofstad, & Krioukov, 2018). Indeed, it has been argued that “knowledge of whether or not a distribution is heavy-tailed is far more important than whether it can be fit using a power law” (Stumpf & Porter, 2012).
- Rank frequencies of subject matter classifications are power law-like
Rather than concentrate on the worthwhile practice of using statistical physics to test for power law signatures and its application to the data in question, I instead would like to suggest that the distribution shown in Figure 6 should be characterized as being a “power law-like” relationship.
By “power law-like,” I suggest that the empirical subject matter rank frequency distribution for the Getty Archival Inventories dataset exhibits approximately regularly proportional relationships in the changes between rank and frequency throughout the distribution. This regular proportionality suggests that the entire distribution from the highest to the lowest ranked classification might be roughly explainable by a singular set of “first principles” (Pan & Sinha, 2010).
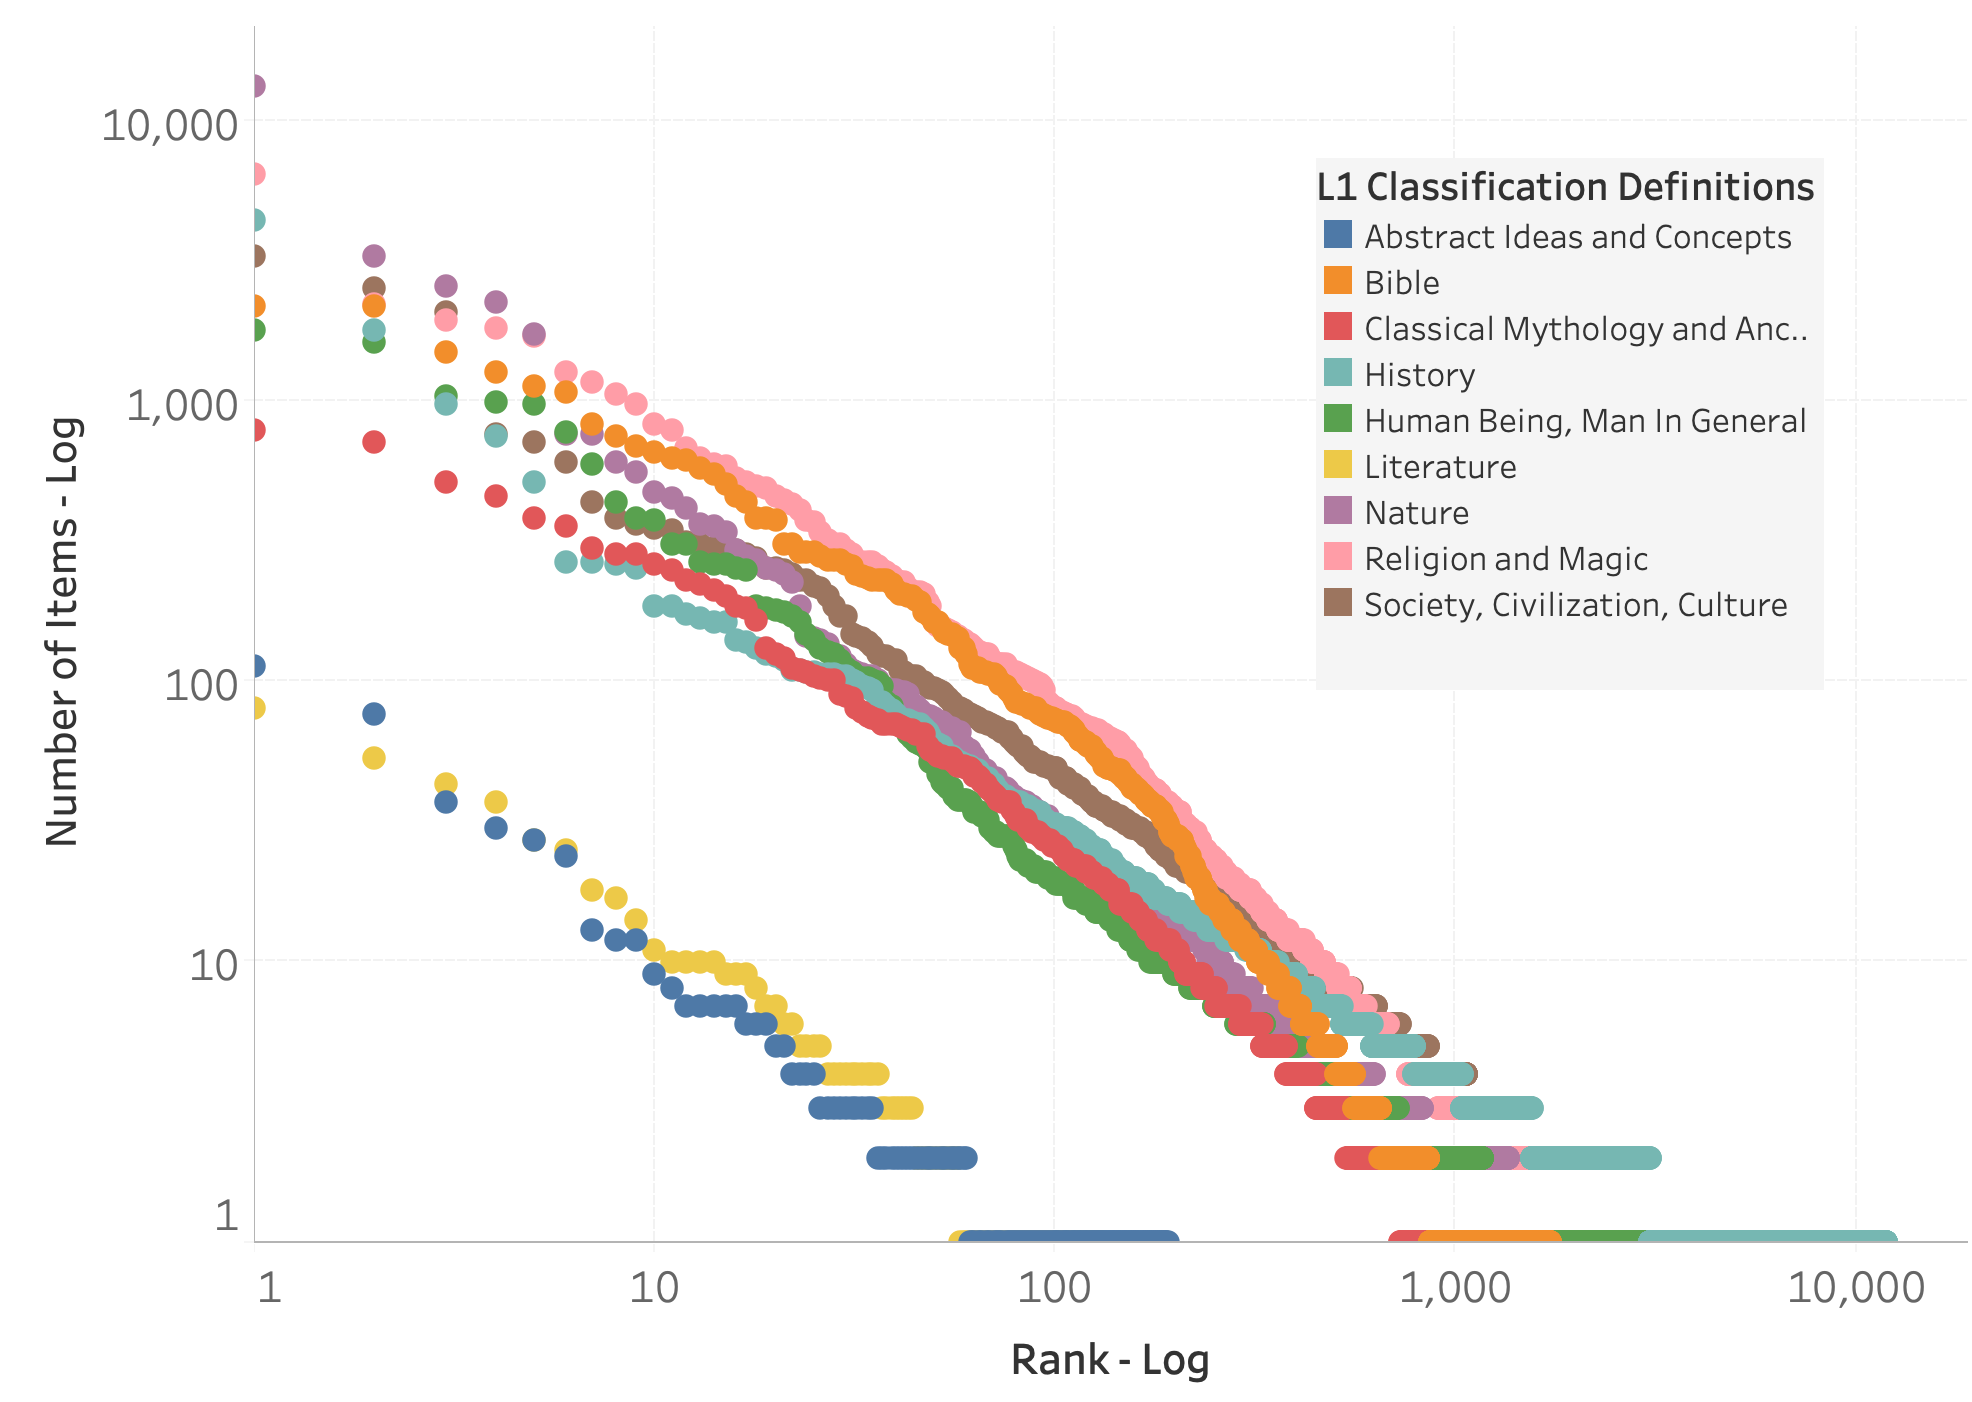
A second way the Getty dataset exhibits power-law like distributions is that there are multiple levels of self-similarities (Brown et al., 2002). The general distribution pattern found for the whole exists at many levels in the parts (Gell-Mann, 1995; Pollacci, Guidotti, Rossetti, Giannotti, & Pedreschi, 2018). We see the same heavy-tailed type of distribution we found in looking at the data as a whole (Figure 6) if we look at the rank frequency of full classifications in segmenting the data by country (Figure 7), by all 9 L1 Classifications (Figure 8), by the top 100 L2 Classifications (Figure 9), by the top 100 L3 Classifications (Figure 10) and even among the top 100 individual inventories (Figure 11).
Figure 7. Full classification distributions among dataset countries are power law-like.
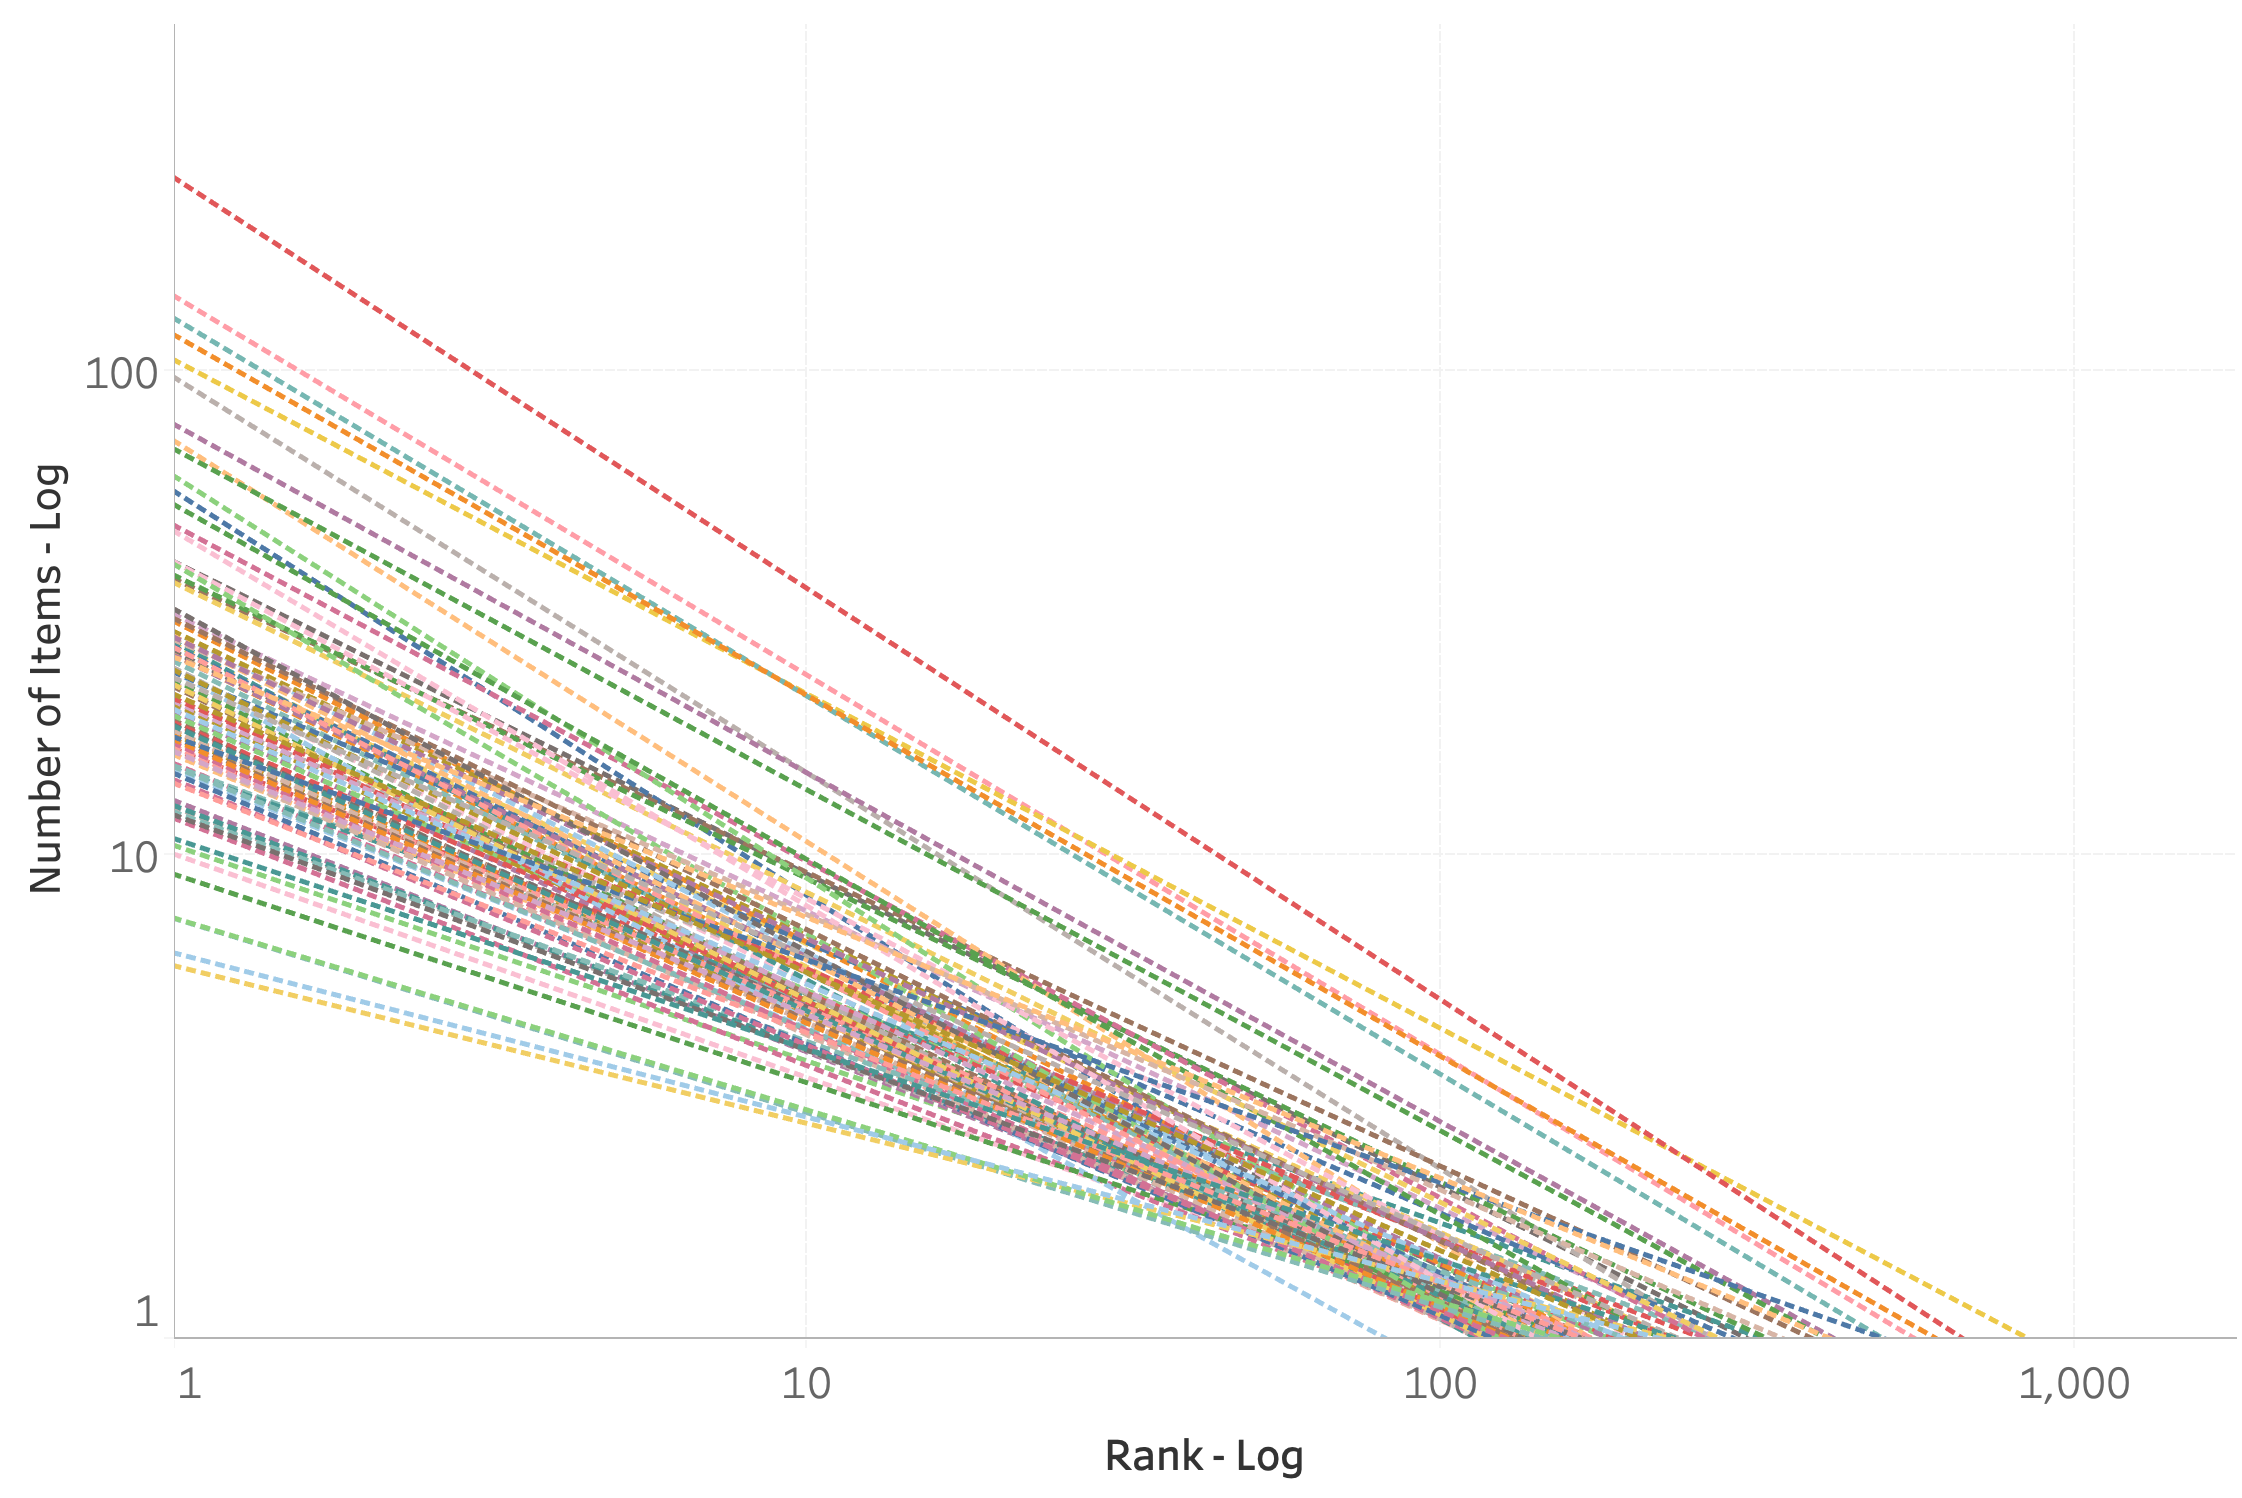
In Figure 11, we see a trend among the top 100 inventories. In general, the trend slope for inventories tends to grow shallower the smaller the size of the inventory. This indicates that the richness of a collection’s vocabulary increases as a collection grows.
In considering words in texts, this phenomenon was popularized by Harold Stanley Heap (Heaps, 1978) and is known as “Heap’s Law.” Heap’s Law states that the number of unique words in a given text will grow proportionally with the size of the text.
- Unique classifications increase proportionally to inventory size
Just as we find a correspondence in the dataset to Zipf’s Law for rank frequencies in words in text, we also find a correspondence to Heap’s Law for the growth of word diversity as the size of a text increases. Figure 12 shows the distribution of the number of distinct classifications as a function of Inventory Size. This plot shows a dot for each unique subject matter classification for each inventory. The dot is placed on the Y axis by the count of items with the same classification (25,944 unique classifications) and on the X axis by the size of the inventory (4,171 unique inventories).
Figure 12. As inventory size grows, so does the number of unique classifications.
What Figure 12 demonstrates is that not only does the number of unique classifications grow with inventory size (which could be readily expected), but that it grows in a non-linear fashion (which is not as readily expected). The slope of the trend line for the Getty Archival Inventories dataset distribution in Figure 12 is 0.92. This is quite different than the slope of 0.4 – 0.6 that is expected for text distributions. Likely, this is due to the fact that are magnitudes more words that can be used in a text as opposed to the 25,944 subject classifications used in the Getty Archival Inventories dataset. The overall steeper “Heap’s Law” trend line for the dataset suggests that there is less diversity in subject matter classifications among paintings as inventories size grow than words among texts as the size of a text grows.
Heap’s Law and Zipf’s Law have been suggested by scholars to be interdependent with some suggesting that Heap’s Law is a result of Zipf’s Law ((Lü, Zhang, & Zhou, 2010) and some that Zipf’s Law is a result of Heap’s Law (Serrano, Flammini, & Menczer, 2009) .
- Regional differences between classification popularity by country
So far, we have looked at the distributions of subject matter classifications in the dataset without necessarily considering what the classifications denote. As shown in Figure 7, there exists a power-law like distribution among classifications for both Italy and the Netherlands. However, when one compares top-ranked classifications, however, there are distinct differences among their relative rankings.
Figure 13. Significant differences among top L3 rankings between Italy and The Netherlands. Circle sizes reflect proportion of classification in each country.
Figure 13 demonstrates that, even though power-law like distributions do exist for both countries, different subject matters are ranked very differently in each country. No doubt, some of the explanation for this difference can be due to the fact that for the years covered by the dataset, The Netherlands was a Protestant country and Italy was a Catholic country. Protestantism, in general, discourages religious imagery.
- City of Rome inventories generally agree on top ranked subject matter classifications; diversity in lower ranks.
To further examine how individual collections might be formed, it is helpful to eliminate the regional influence in comparing subject matter popularity. If we focus on just one city, Rome, we can accomplish this goal. In all, the dataset contains records from 449 different inventories from that city describing about 80,000 items with 9,486 distinct full subject matter classifications.
What we find is that there is rough agreement among the highest ranked classifications, but after that, for the lower ranked classifications, individual inventories have different areas of focus from each other (Figure 14).
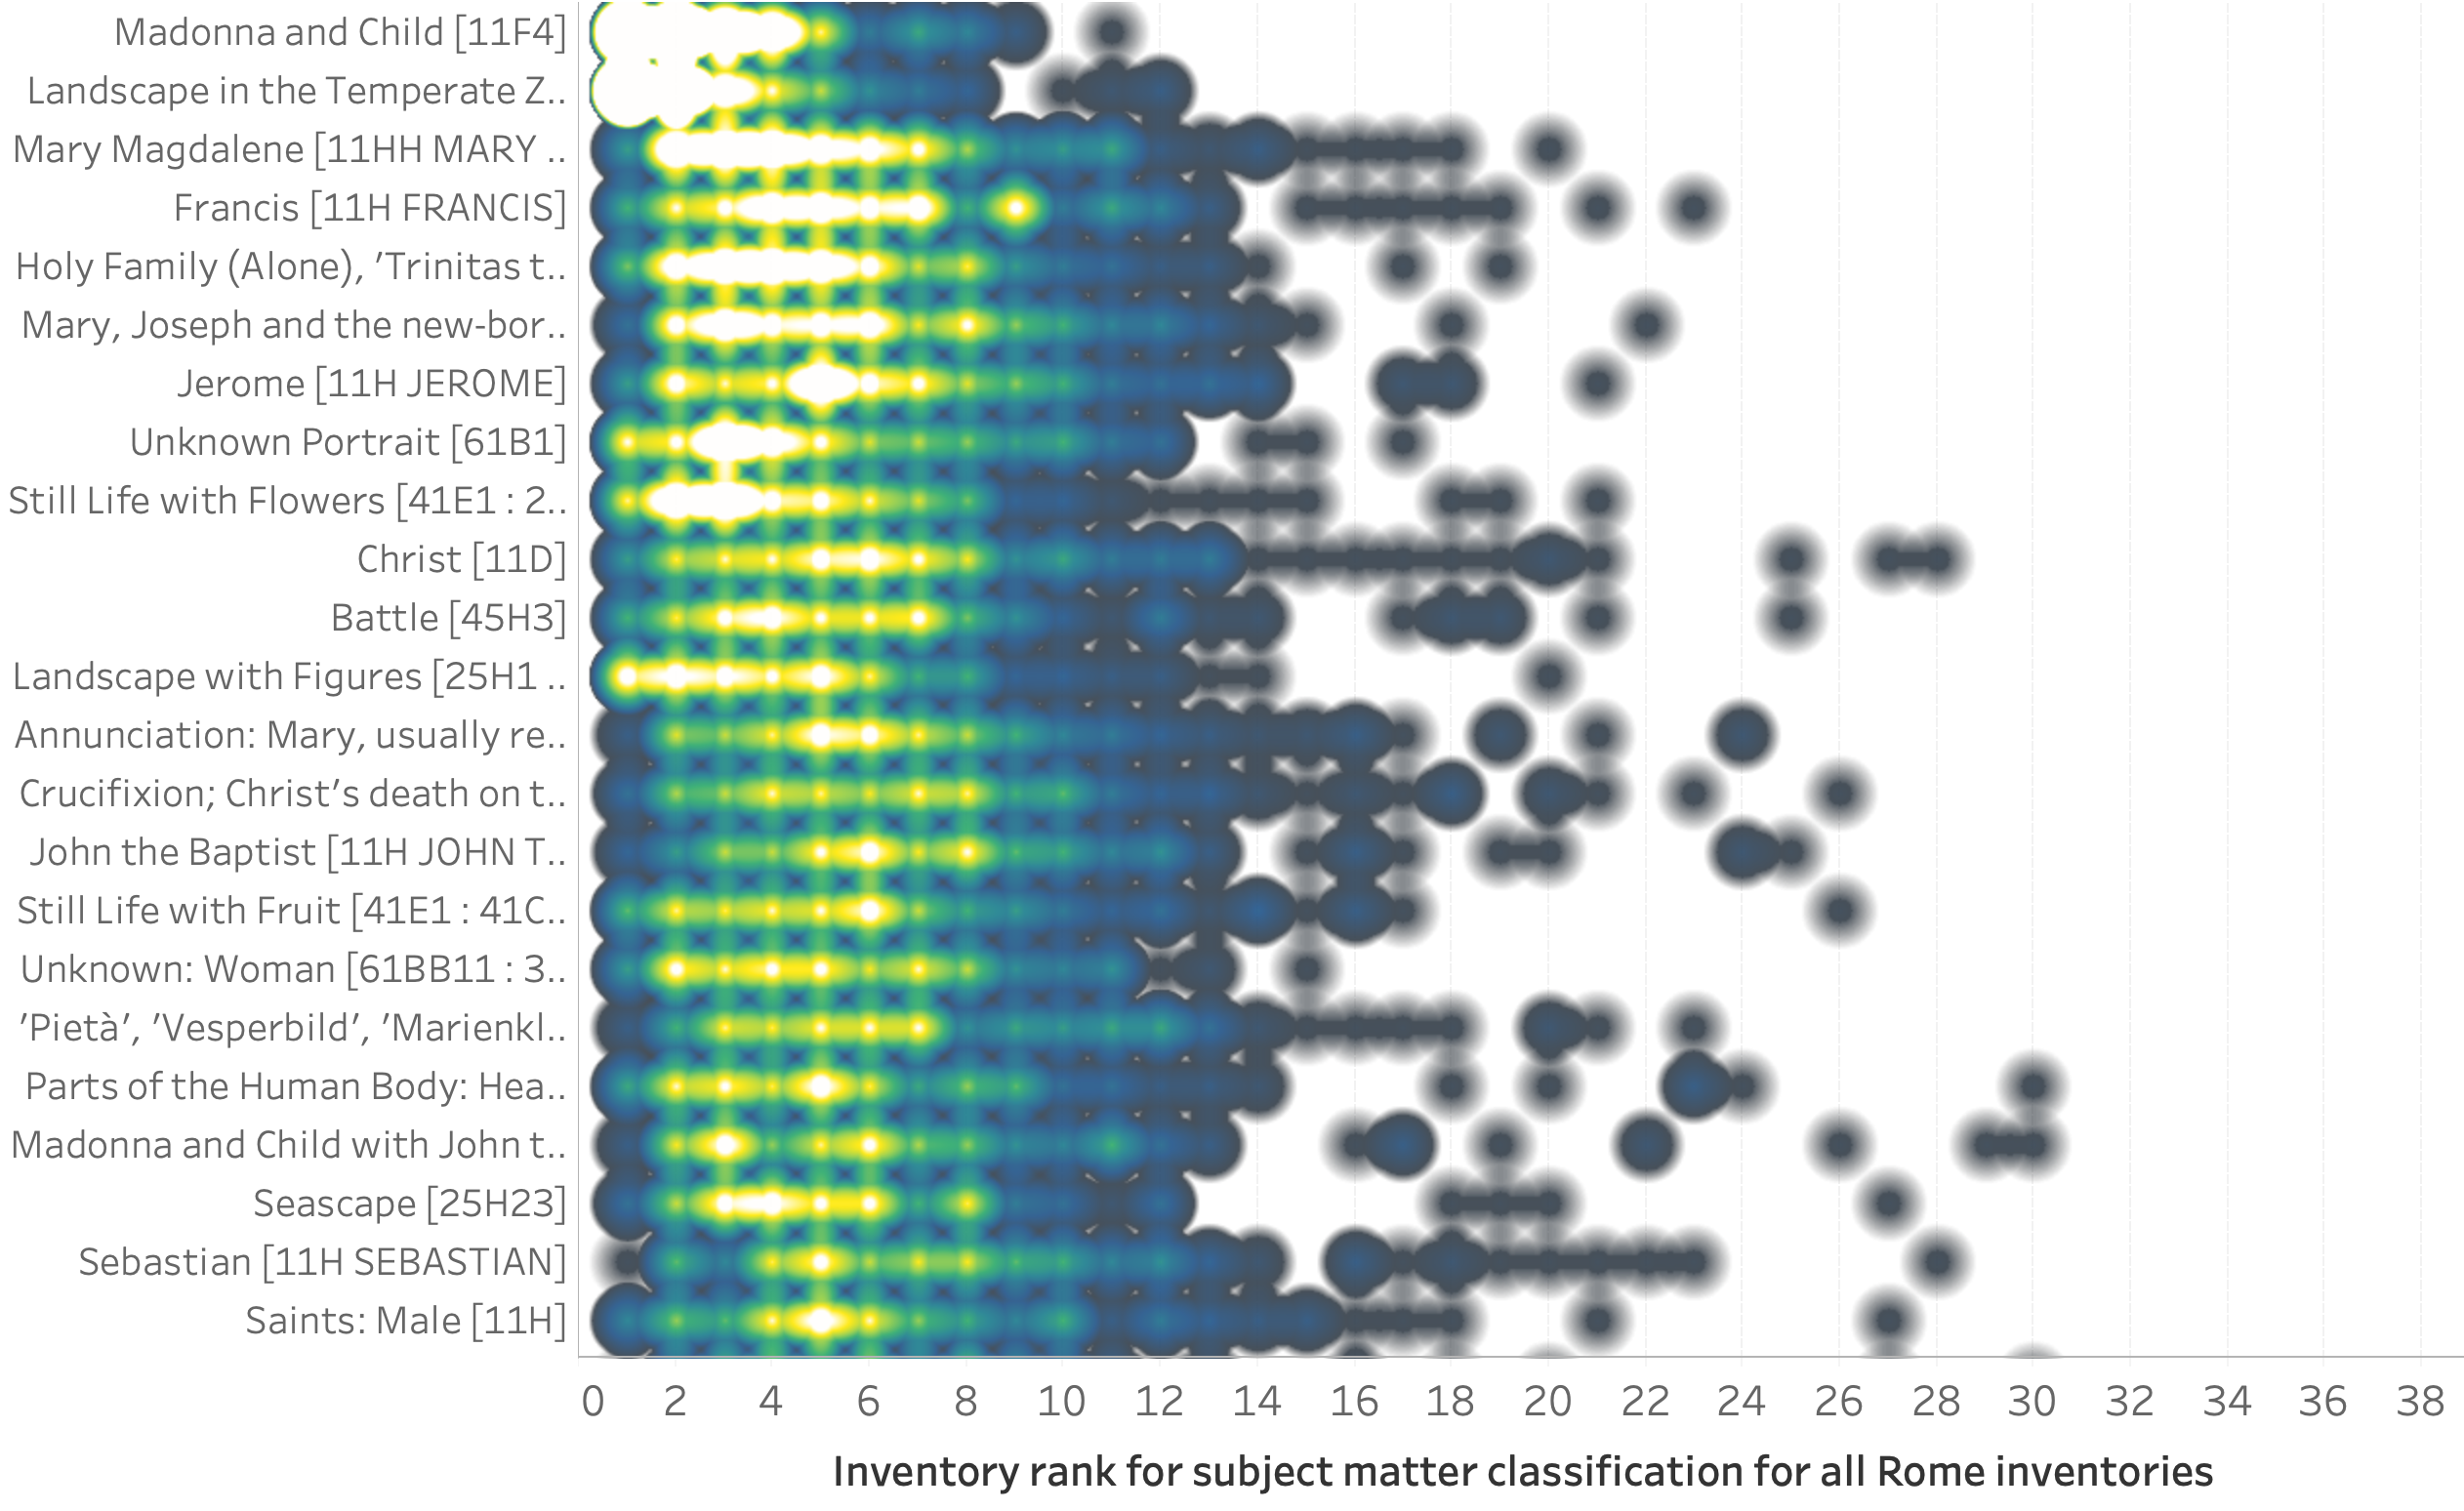
Figure 14. Rome inventories show rough agreement on the most popular full classifications, but individual inventories show unique focus. Dot size and hue change with the number of inventories that have the same rank for a particular full subject matter.
- Different regimes of popularity consensus for city of Rome inventories
Drilling further down into just the city of Rome data, we can look at the consensus among inventories and classifications in a different way. Figure 15 shows the inventory popularity distribution of full subject matter classifications by plotting each classification’s rank against the percentage of inventories that contain that classification.
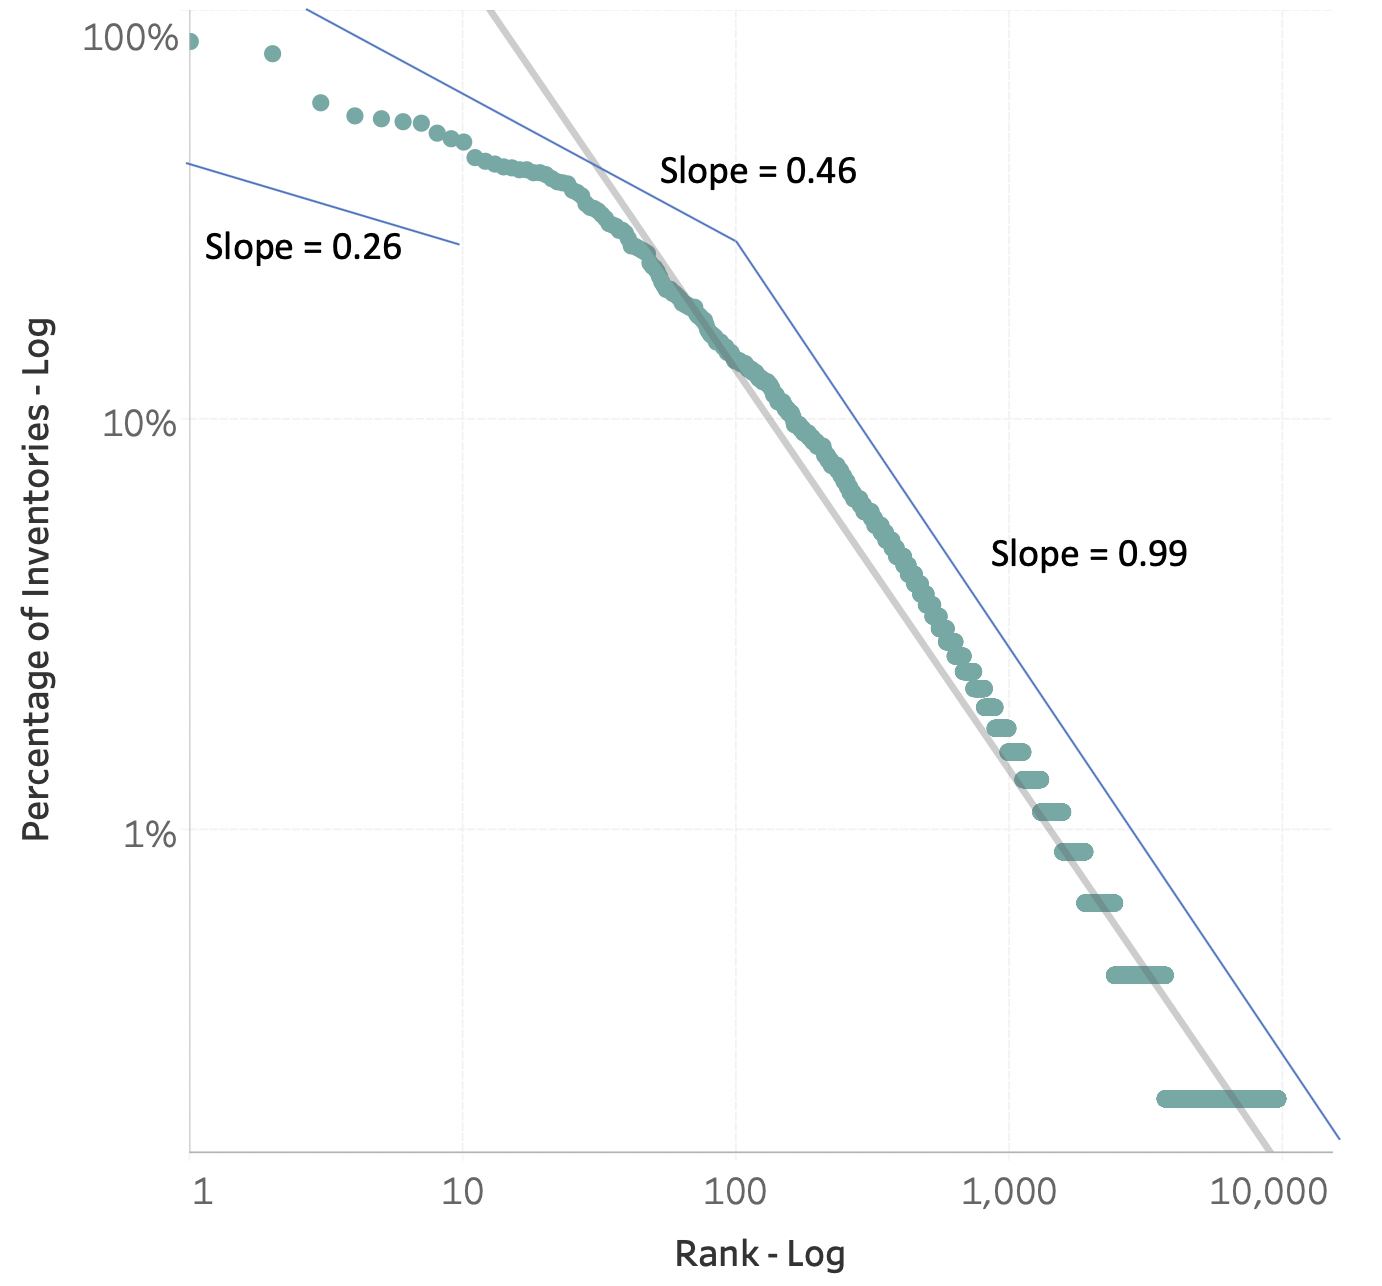
Figure 15. Full classification popularity by the percentage of inventories that contain them. City of Rome. About 61% of classifications occur in just one of the inventories while the single highest ranked classification (Madonna and Child) is found in 84% of the inventories. The power trend line slope for the top 10 classifications is 0.26, for the top 100 classifications 0.46 and for all classifications 0.98.
In examining this distribution of consensus, we find two different regimes. For the most popular full classifications, as ranks decrease there is a much gentler change in the percentage of inventories that contain the most popular classifications than for the lesser ranked classifications.
- Discussion
- Explanations for Zipf’s Law in word rank frequencies
There have been many explanations suggested for why Zipf distributions occur in language (Piantadosi, 2014). Zipf, himself, suggests that the existence of the power law distribution found in rank frequencies is due to the competing wishes of the writer to use as few unique words as possible to minimize writing effort and the wishes of the reader to see as many unique words as possible to minimize the effort of what is being communicated. Zipf calls this “The law of least effort” (Piantadosi, Tily, & Gibson, 2012; Zipf, 1949).
Benoit Mandelbrot suggests that the rank frequency power law among words is caused by a wish to minimize effort, but effort of a different type. Mandelbrot suggests that the power law observed by Zipf was related to the cost of using different word lengths (Mandelbrot, 1953).
Herbert Simon suggests a different generative mechanism for the observed power law. He argues that once a word has been used, it is more likely to be reused in a text. This proportionally generated reuse of words already used can be shown to generate a power law distribution. Noting that this sort of proportional growth dynamic was identified by Udny Yule (Yule, 1925) in examining how the frequencies of species across genera vary (much like the frequency of Iconclass categories across levels of classifications vary), Simon proposed that this principle be named the Yule-Simon law of proportional attachment (Simon, 1955).
The Yule-Simon law of proportional attachment was proposed by Albert-László Barabási and Réka Albert to explain power law distributions in networks (particularly the Internet) and popularized as the Law of Preferential Attachment (Barabási & Albert, 1999; Simkin & Roychowdhury, 2010).
A last (among many) theorized generative principles for power laws is “self-organized criticality.” This idea is often illustrated by thinking of a mound of sand on a table that grains of sand are continuously dropped onto from above. The shape of the mound remains largely the same as the friction of the sand grains work to maintain a mound shape while the force of gravity works to flatten the mound. However, on a micro-level, as we continue to add sand from above, we would find patterns and cascades of avalanches as sand drops off the table. It is said, in this sense, power laws can be seen as evidence of a system that is on the borderline of chaos and order (Bak, Tang, & Wiesenfeld, 1988).
This concept of “self-organized criticality” is implicitly suggested in both Zipf’s and Mandelbrot’s generative theories for power laws in word rank frequencies. Zipf argues that the power law distribution exists due to competing desires of the writer and reader to minimize effort. Mandelbrot argues the power law distribution exists due the wish to maximize information transmitted while minimizing the creative cost of creating the transmission.
- But… artworks are different than words
As the start of this paper, it was noted that paintings are different than words. All three of the theories discussed above rely, to some extent on communication constraints leading to the existence of a power law. Certainly, we could shoe horn art collection curation into the explanations for word rank distributions offered above. Like Zipf, we could suggest that artists sought to minimize effort in creating artworks by using as few subject matters as possible while patrons sought to minimize effort in understanding artworks by seeking as many specific subject matters as possible. Following Mandelbrot, we could suggest that painters faced a cost to create new subject matters and a wish to maximize the information transmitted by their artwork. Finally, following Simon, we could suggest that collectors choose to add new artworks to their collection in proportion to which those subject matters already existed in their collections.
Rather than seeing artworks and their classifications as being like words contained in a text, I suggest that artworks are much more like books collected into a personal library. While words are independent units of meaning that gain further context in how they are combined, paintings offer something like a story in and of themselves.
This is not to say that paintings were not consciously displayed in combination with each other historically. Collectors were known to arrange paintings in a display where the whole was greater than its parts aesthetically (Ago, 2013, p. 149). It was also not uncommon for collectors to display portrait pictures so that the subjects seemed to face each other in a dialog (Gail Feigenbaum, 2014, p. 4). However, these practices of combining paintings in a display are much different in nature than combining words in a text to communicate something greater than the words individually.
- Art collections as “cultural stuff”
In considering societal and cultural evolution, (Devezas & Modelski, 2003) suggests the following:
Here we have the contrast between society and culture: society that is made up of social organizations and institutions, and culture that is made up of the human patrimony of knowledge and experience, some of it embodied in memory, some in artifacts, and accumulated over many generations. This patrimony is the ensemble of values, customs, and technologies that played and continue to play an essential role in the evolution of our behavior, and, in this sense, culture serves as a mechanism of adaptation.
Following this line of thought, it can be said that the stuff of culture does not really “evolve,” but merely accumulates (Gould, 2011, p. 217). Instead, as a society evolves/changes, the way that society curates the stuff of its culture changes. This curatorial process does not change the constituents of the culture itself but changes the significance and relationships of the constituents and controls, in part, what new constituents are added to the culture.
In a very real sense, the art collections studied in this paper embody exactly this sort of dynamic. The art works inventoried are, in themselves, the stuff of culture. Each collection’s curator inherits, commissions or otherwise acquires new paintings. At the same time, each collection’s curator actively decides to display, store or dispose (mostly sell or gift) works that are already in the inventory or come into the inventory. On a micro level, the way that each art collection grows/reformulates over time is exactly the way that culture grows/reformulates over time. It is the tension found between meaning-making and meaning-maintenance (Taylor, Stoltz, & McDonnell, 2019). If we can understand the first principles guiding art collection curation, we might be able to understand some of the first principles guiding cultural change overall.
- Proposed generative first principles for subject matter rank power laws in artworks
In examining the phenomenon of rank frequency power laws in text, Simon proposed the law of “proportional attachment.” In examining rank frequencies among artwork subject matter classifications, I suggest we consider a similar mechanism, but more appropriately think of it as a law of “proportional curation.” Artworks are not words, they are collected objects and the collections they reside in are curated by a collector.
My findings suggest that the ways art collections in the dataset were curated resulted in 1) a Zipf distribution in the rank frequency of subject matter, 2) a general agreement between localized collections in top ranked subject matter classifications, 3) less agreement in inter-collection consensus among the lower ranked subject matter classifications. I argue that these findings suggest two different “first principles” to explain the patterns found among subject matter rank frequency distributions in the dataset. Both are variants of a proportional/preferential curation process.
First, for the highest ranked subject matters in collections, collectors include subject matters in their collection proportionately/preferentially to the collectors around them (external referenced curation). Second, for the lesser ranked subject matters, collectors include subject matters in their collection proportionally to the popularity of these subject matters within their own collection (internal referenced curation).
- External referenced proportional/preferential curation
Many models and theories of cultural change explicitly examine the role of external reference among agents as a generative “first principle.” In general, the drive for conformity has been well documented in the social sciences. A relevant experimental study demonstrating how conformity might operate in art collection curation is documented by Salganik and Watts (Salganik & Watts, 2009) in their 2009 Music Lab study.
In one round of this study, eight online “test worlds” of participants were shown how often specific songs among a set of 48 songs were downloaded by others. As a test for social influence, another set of participants were not shown download statistics on their web pages (independent world). All users were given the opportunity to listen to and download any of the songs. For the worlds where online participants saw the download statistics of others, there was a very skewed distribution of song download popularity, roughly only 20% of the songs were represented in 50% of the downloads. In contrast, in the independent world, where participants did not see others’ download statistics, there was a much more even distribution among downloads, almost 40% of the songs were represented in 50% of the downloads.
Figure 16. Music Lab (2009) findings. Strong social influence round. For worlds where the participants saw download choices of others, herding effects were exhibited. 7,192 total participants in study.
A further finding of the Music Lab studies was that there was little agreement between the worlds in which songs were most downloaded. The study showed that download popularity was driven more by herding/conformity effects than the intrinsic quality of the songs most popularly downloaded.
In a similar fashion, Moshe Adler argued that herding/conformity effects drive a power law distribution in artist popularity (Adler, 1985). Adler argues that even among equally-talented superstars, the drive among people to share a common culture results in a very skewed distribution of artist popularity (Gergaud & Verardi, 2006).
Likewise, I propose that there is nothing particularly intrinsic in one subject matter classification that makes it more worthy of popularity than any other. Instead, social forces of conformity and the drive to share a common culture that results in the skewed popularity distributions found. Note that, for example, for the city of Rome, artworks showing the Madonna and the Christ Child (84% of collections) were much more popular than artworks showing Christ alone (49%) and artworks showing Still Life with Flowers (49% of collections) were much more popular than artworks of Still Life with Flowers and Fruit (19%). While we can postulate theories to fit these facts, it is unlikely that any of these theories would be as persuasive as the argument that it was herding/conformity effects among collectors that drove these skewed distributions of popularity and not something intrinsic about the subject matter classifications themselves.
- Internal focused proportional/preferential curation
Most theories and models of cultural change see culture in quite a different way than I propose based on my empirical findings looking at curated art collections. Rather than seeing culture as an accumulated patrimony of objects and ideas that both mediates and is mediated by individuals and institutions, two other views are commonly given. Either culture is seen as a world existing in itself or culture is seen as world existing only in humans (Kashima, Bain, & Perfors, 2019). As an example of the first view, Bentley, et. al, model cultural drift as variations occurring in different generations of the expression of that culture without human interaction (Bentley et al., 2004). As an example of the second view, the seminal Axelrod Cultural Diffusion model views culture as something that diffuses through agent interaction, but does not grow/accumulate externally to the agents (Axelrod, 1997).
I argue that cultural dynamics are somewhat more complex. Culture is an emergent phenomenon that arises from the aggregate interactions of people, but it is also a phenomenon that starts as a personal thing. Culture can be seen as a self-organized criticality resulting from the interplay of the individual pursuing their own personal focus and the individual conforming to practices observed and interpreted around them (Bikhchandani, Hirshleifer, & Welch, 1992).
- A “toy model”
Now that I have proposed two generative first principles for art collection formation based on findings of an empirical dataset, we could test out my proposal with a “toy model” using Agent-Based Modeling. Such a toy model allows us to create a thought experiment (Papert, 1980) to ask to what degree do simple computer agent collectors need to be externally focused or internally focused in their proportional/preferential curation so that the subject matter distribution that emerges shows a power law-like distribution like that found in Figure 5 and a bipartite distribution of inter-inventory agreement like that found in Figure 15.
Table 2
Pseudo-code for a “toy model.”
| At initiation:
At Run:
Test:
|
- Conclusion
It is remarkable that the distribution of subject matter popularity among art collections in the early modern world exactly match the proposed distribution of word popularity among texts. As I have argued, words are much different than images.
What this exact correspondence hints is that there might be simple first principles that both guide text formation and art collection formation, although it is unlikely they are precisely the same first principles. As we seek to strengthen our theoretical understanding of social and cultural order, I believe it important, as we did in this paper, to begin with an empirical baseline for our search.
If the curation of art collections is not just one example of cultural formation, but instead a useful model for understand of cultural formation in general, we open up new ways to understand the complexities of culture itself.
Bibliography
Adler, M. (1985). Stardom and talent. The American Economic Review, 75(1), 208–212.
Ago, R. (2013). Gusto for things: a history of objects in seventeenth-century Rome. University of Chicago Press.
Alizadeh, M., & Cioffi-Revilla, C. (2014). Distribution of Opinions: Insights from Agent‐Based Modeling (SSRN Scholarly Paper No. ID 2830372). Retrieved from Social Science Research Network website: https://papers.ssrn.com/abstract=2830372
Axelrod, R. (1997). The Dissemination of Culture: A Model with Local Convergence and Global Polarization. Journal of Conflict Resolution, 41(2), 203–226. https://doi.org/10.1177/0022002797041002001
Axtell, R. L. (2001). Zipf Distribution of U.S. Firm Sizes. Science, 293(5536), 1818. https://doi.org/10.1126/science.1062081
Bak, P., Tang, C., & Wiesenfeld, K. (1988). Self-organized criticality. Physical Review A, 38(1), 364.
Barabási, A.-L., & Albert, R. (1999). Emergence of Scaling in Random Networks. Science, 286(5439), 509–512.
Bentley, R. A., Hahn, M. W., & Shennan, S. J. (2004). Random Drift and Culture Change. Proceedings: Biological Sciences, 271(1547), 1443–1450.
Bikhchandani, S., Hirshleifer, D., & Welch, I. (1992). A theory of fads, fashion, custom, and cultural change as informational cascades. Journal of Political Economy, 100(5), 992–1026.
Blunt, A. (1939). An Echo of the “Paragone” in Shakespeare. Journal of the Warburg Institute, 2(3), 260–262. https://doi.org/10.2307/750102
Brown, J. H., Gupta, V. K., Li, B.-L., Milne, B. T., Restrepo, C., & West, G. B. (2002). The fractal nature of nature: power laws, ecological complexity and biodiversity. Philosophical Transactions of the Royal Society of London. Series B: Biological Sciences, 357(1421), 619–626.
Clauset, A., Shalizi, C. R., & Newman, M. E. (2009). Power-law distributions in empirical data. SIAM Review, 51(4), 661–703.
Cutting, J. E., DeLong, J. E., & Brunick, K. L. (2018). Temporal fractals in movies and mind. Cognitive Research: Principles and Implications, 3(1), 8.
Devezas, T., & Modelski, G. (2003). Power law behavior and world system evolution: A millennial learning process. Technological Forecasting and Social Change, 70(9), 819–859.
Drăgulescu, A., & Yakovenko, V. M. (2001). Exponential and power-law probability distributions of wealth and income in the United Kingdom and the United States. Physica A: Statistical Mechanics and Its Applications, 299(1), 213–221. https://doi.org/10.1016/S0378-4371(01)00298-9
Etro, F., & Stepanova, E. (2018). Power-laws in art. Physica A: Statistical Mechanics and Its Applications, 506, 217–220. https://doi.org/10.1016/j.physa.2018.04.057
Gabaix, X., & Ioannides, Y. M. (2004). Chapter 53 – The Evolution of City Size Distributions. In J. V. Henderson & J.-F. Thisse (Eds.), Handbook of Regional and Urban Economics (pp. 2341–2378). https://doi.org/10.1016/S1574-0080(04)80010-5
Gail Feigenbaum. (2014). Introduction: Art and Display in Principle and in Practice. In Francesco Freddolini & Gail Feigenbaum (Eds.), Display of art in the Roman palace, 1550-1750.
Gell-Mann, M. (1995). The Quark and the Jaguar: Adventures in the Simple and the Complex. Macmillan.
Gergaud, O., & Verardi, V. (2006). Untalented but successful.
Gillespie, C. S. (2014). Fitting heavy tailed distributions: the poweRlaw package. ArXiv Preprint ArXiv:1407.3492.
Gombrich, E. H. (1948). Icones Symbolicae: The Visual Image in Neo-Platonic Thought. Journal of the Warburg and Courtauld Institutes, 11, 163–192. https://doi.org/10.2307/750466
Gould, S. J. (2011). Full house. Harvard University Press.
Heaps, H. S. (1978). Information retrieval, computational and theoretical aspects. Academic Press.
Kashima, Y., Bain, P. G., & Perfors, A. (2019). The Psychology of Cultural Dynamics: What Is It, What Do We Know, and What Is Yet to Be Known? Annual Review of Psychology, 70, 499–529.
Keating, J., & Markey, L. (2010). Introduction: captured objects: inventories of early modern collections. Journal of the History of Collections, 23(2), 209–213.
Kim, D., Son, S.-W., & Jeong, H. (2014). Large-Scale Quantitative Analysis of Painting Arts. Scientific Reports, 4, 7370. https://doi.org/10.1038/srep07370
Krashakov, S. A., Teslyuk, A. B., & Shchur, L. N. (2004). On the universality of rank distributions of website popularity. Retrieved from http://arxiv.org/abs/cs/0404010
Krings, G., Calabrese, F., Ratti, C., & Blondel, V. D. (2009). Urban gravity: a model for inter-city telecommunication flows. Journal of Statistical Mechanics: Theory and Experiment, 2009(07), L07003.
Lü, L., Zhang, Z.-K., & Zhou, T. (2010). Zipf’s Law Leads to Heaps’ Law: Analyzing Their Relation in Finite-Size Systems (Zipf’s Law Leads to Heaps’ Law). PLoS ONE, 5(12), e14139. https://doi.org/10.1371/journal.pone.0014139
Manaris, B., Romero, J., Machado, P., Krehbiel, D., Hirzel, T., Pharr, W., & Davis, R. B. (2005). Zipf’s Law, Music Classification, and Aesthetics. Computer Music Journal, 29(1), 55–69. https://doi.org/10.1162/comj.2005.29.1.55
Mandelbrot, B. (1953). An Informational Theory of the Statistical Structure of Language. Communication Theory, 486–502.
Martínez-Mekler, G., Martínez, R. A., Río, M. B. del, Mansilla, R., Miramontes, P., & Cocho, G. (2009). Universality of Rank-Ordering Distributions in the Arts and Sciences. PLoS One; San Francisco, 4(3), e4791. http://dx.doi.org.mutex.gmu.edu/10.1371/journal.pone.0004791
McManus, I. C. (2006). Measuring the culture of CP Snow’s two cultures. Empirical Studies of the Arts, 24(2), 219–227.
Newman, M. E. J. (2005). Power laws, Pareto distributions and Zipf’s law. Contemporary Physics, 46(5), 323–351. https://doi.org/10.1080/00107510500052444
Pan, R. K., & Sinha, S. (2010). The statistical laws of popularity: universal properties of the box-office dynamics of motion pictures. New Journal of Physics, 12(11), 115004. https://doi.org/10.1088/1367-2630/12/11/115004
Papert, S. (1980). Mindstorms: Children, computers, and powerful ideas. Basic Books, Inc.
Piantadosi, S. T. (2014). Zipf’s word frequency law in natural language: A critical review and future directions. Psychonomic Bulletin & Review, 21(5), 1112–1130.
Piantadosi, S. T., Tily, H., & Gibson, E. (2012). The communicative function of ambiguity in language. Cognition, 122(3), 280–291.
Pollacci, L., Guidotti, R., Rossetti, G., Giannotti, F., & Pedreschi, D. (2018). The Fractal Dimension of Music: Geography, Popularity and Sentiment Analysis. In B. Guidi, L. Ricci, C. Calafate, O. Gaggi, & J. Marquez-Barja (Eds.), Smart Objects and Technologies for Social Good (pp. 183–194). Springer International Publishing.
Richardson, L. F. (1960). Statistics of deadly quarrels.
Salganik, M. J., & Watts, D. J. (2009). Web-based experiments for the study of collective social dynamics in cultural markets. Topics in Cognitive Science, 1(3), 439–468. https://doi.org/10.1111/j.1756-8765.2009.01030.x
Serrano, M. Á., Flammini, A., & Menczer, F. (2009). Modeling Statistical Properties of Written Text. PLOS ONE, 4(4), e5372. https://doi.org/10.1371/journal.pone.0005372
Simkin, M. V., & Roychowdhury, V. P. (2010). Re-inventing Willis. Physics Reports. https://doi.org/10.1016/j.physrep.2010.12.004
Simon, H. A. (1955). On a Class of Skew Distribution Functions. Biometrika, 42(3/4), 425–440. https://doi.org/10.2307/2333389
Stumpf, M. P. H., & Porter, M. A. (2012). Mathematics. Critical truths about power laws. Science (New York, N.Y.), 335(6069), 665–666. https://doi.org/10.1126/science.1216142
Taylor, M. A., Stoltz, D. S., & McDonnell, T. E. (2019). Binding significance to form: Cultural objects, neural binding, and cultural change. Poetics.
Van Straten, R. (1986). Panofsky and ICONCLASS. Artibus et Historiae, 7(13), 165–181. https://doi.org/10.2307/1483254
Voitalov, I., Van Der Hoorn, P., Van Der Hofstad, R., & Krioukov, D. (2018). Scale-free Networks Well Done. Retrieved from http://arxiv.org/abs/1811.02071
Yu, S., Xu, C., & Liu, H. (2018). Zipf’s law in 50 languages: its structural pattern, linguistic interpretation, and cognitive motivation. ArXiv Preprint ArXiv:1807.01855.
Yule, G. U. (1925). A Mathematical Theory of Evolution, Based on the Conclusions of Dr. J. C. Willis, F.R.S. Philosophical Transactions of the Royal Society of London Series B, 213, 21–87.
Zipf, G. K. (1949). Human Behavior and the Principle of Least Effort: An Introduction to Human Ecology. Mansfield Centre, Conn: Martino Fine Books.